3D Data Visualisation with Python and Blender

3D Data Visualisation with Python and Blender

With support from a grant from IT Innovation Challenges the IDN team worked with Dr Allexander Shenkin of OUCE and Mattia Montanari of Engineering Science to convert and import research data into Blender, a FOSS (Free and Open Source Software) tool for high quality 3D modelling, rendering and animation. In both cases, Blender's deeply integrated support for the Python scripting language greatly facilitated the process.   

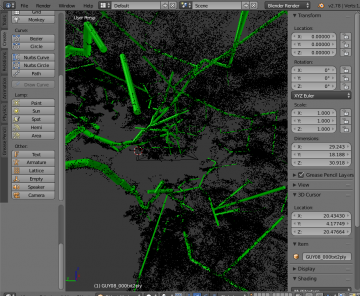
In this case, point cloud data derived from in-the-field LIDAR scans of foliage was processed by a third party script to produce multiple cylinders approximating plant structures. Using Python to import the output of this script, Blender can display both the point cloud and cylinder-fits in the same scene, and permit the tweaking of the cylinders to best correct problems with the initial script output. 

Blender screenshot with points and cylinders


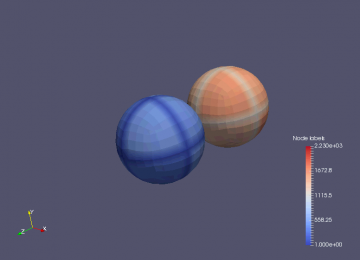
Here the fact that both Paraview and Blender support deep scripting using Python enabled us to save frame-by-frame scene data from Paraview in a form that could be imported into Blender. Paraview data was converted to a series of OBJ files which were in turn imported to Blender using a Python script that assembled them into a mesh sequence suitable for high quality rendering. In this case the aim was to provide a more impactful visual display of the results of a physical simulation than was possible using Paraview alone. 

Example paraview scene

How was this built?

These visualisations were built using Blender.

Dr. Alexander Shenkin and Dr. Mattia Montanari each approached University of Oxford's IT Reseach Support team for assistance in creating an interactive 3D visualisation of their research data. Rowan Wilson assisted them in creating the 3D renders shown here.

There are many different software packages designed for the 3D visualisation of point fields and mesh surfaces, Blender is one of the most powerful FOSS offerings available for this purpose.

To replicate this interactive visualisation for yourself, contact the researchsupport@it.ox.ac.uk team and ask for assistane in using Blender.

Case Study Details

Academic

Dr. Alexander Shenkin  (http://orcid.org/0000-0003-2358-9367)

Dr. Mattia Montanari (http://orcid.org/0000-0002-7714-5932)

Department

Environmental Change Institute

Solid Mechanics and Materials Engineering

Divison MPLS
Developer Rowan Wilson  (http://orcid.org/0000-0002-2879-176X)